
System Metrics
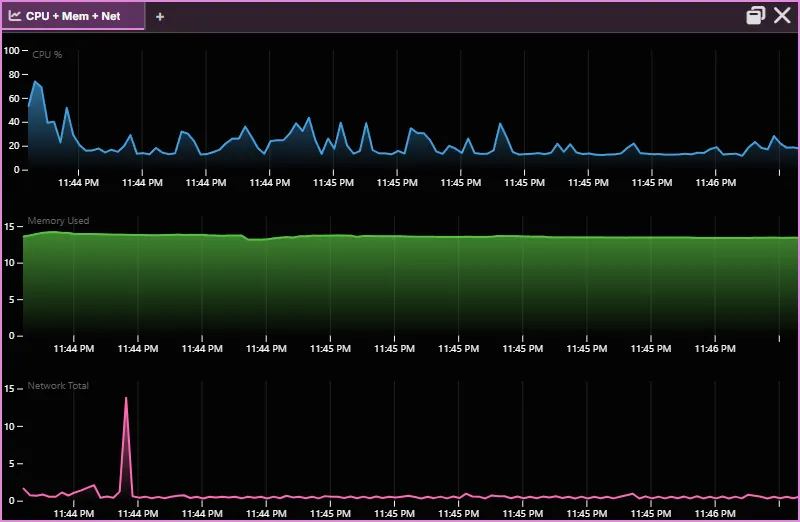
The Sysinfo pane displays live system metrics for the machine AgentMux runs on, as time-series line plots.
Opening Sysinfo
Section titled “Opening Sysinfo”- Click Sysinfo (chart icon) in the widget bar. It is pinned by default.
- Command palette (
Ctrl+P): Open System Info. - Click + on any pane’s tab strip and pick Sysinfo.
- Right-click a pane header → Replace With… → Sysinfo replaces that pane.
- Press
Ctrl+Shift+Kto turn the focused pane into the widget launcher, then choose Sysinfo.
The starter layout on first launch, and in each new window, includes a Sysinfo pane above Swarm, next to the Agent pane.
Available Metrics
Section titled “Available Metrics”The backend collects these values on every sample (crates/srv/src/backend/sysinfo.rs). Memory values are in GB (1024³ bytes) and throughput in MB/s (1024² bytes per second).
| Metric Key | Description |
|---|---|
cpu | Overall CPU usage, the average across all cores (0–100%) |
cpu:0, cpu:1, … | Usage of each core |
Memory
Section titled “Memory”| Metric Key | Description |
|---|---|
mem:used | Memory in use (GB) |
mem:free | Free memory (GB) |
mem:available | Available memory (GB) |
mem:total | Total system memory (GB), used as the ceiling of the memory plots |
Network
Section titled “Network”| Metric Key | Description |
|---|---|
net:bytessent | Network bytes sent (MB/s) |
net:bytesrecv | Network bytes received (MB/s) |
net:bytestotal | Total network throughput (MB/s) |
| Metric Key | Description |
|---|---|
disk:read | Disk read throughput (MB/s) |
disk:write | Disk write throughput (MB/s) |
disk:total | Total disk I/O throughput (MB/s) |
Plot Types
Section titled “Plot Types”Each Sysinfo pane shows one plot type (frontend/app/view/sysinfo/sysinfo-types.ts, PlotTypes). The default is CPU. To switch, right-click the pane header and open Plot Type, or right-click the chart itself. The choice is saved with the pane, and the pane’s title shows the current plot type.
| Plot Type | Metrics Shown |
|---|---|
| CPU | Overall CPU % |
| Mem | Memory used |
| CPU + Mem | Both, one above the other |
| Net | Total network throughput |
| Net (Sent/Recv) | Sent and received separately |
| CPU + Mem + Net | All three, one above another |
| Disk I/O | Total disk throughput |
| Disk I/O (R/W) | Read and write separately |
| All CPU | One plot per core |
When a plot type shows more than two metrics, the charts are arranged in a 2-column grid, except CPU + Mem + Net, which stacks them in one column. All CPU labels the first 32 cores; cores beyond that are plotted without a label.
The Y-axis depends on the metric: CPU is fixed at 0–100%; memory scales with usage up to total memory, with a floor of 1 GB; network and disk scale with the data, with a floor of 1 MB/s.
Data Collection
Section titled “Data Collection”- The backend samples once per second by default. Change this in Settings → Advanced → Sysinfo widget → Sample interval (
telemetry:interval). The settings field accepts 1 second or more; the backend clamps the value to 0.2–2 seconds, so values below 1 second can only be set in the settings file, and anything above 2 samples every 2 seconds. - Samples are streamed to the frontend as
sysinfoevents over the app’s WebSocket. The backend keeps the latest 1024 samples so a newly opened pane can fill in its history. - A plot shows the latest 120 samples by default (2 minutes at the default interval). Change this with History length (
telemetry:numpoints, 30 to 1024) in the same settings section. - If one to three samples are missed, the plot repeats the last value. A longer gap, such as after sleep/wake, leaves a break in the line.
Plot Colors
Section titled “Plot Colors”Each metric type has a CSS variable for theming (frontend/app/theme.scss):
| Metric | CSS Variable |
|---|---|
| CPU | --sysinfo-cpu-color |
| Memory | --sysinfo-mem-color |
| Network | --sysinfo-net-color |
| Disk | --sysinfo-net-color (shared with network) |
Local machine only
Section titled “Local machine only”Sysinfo monitors only the machine AgentMux runs on: the backend runs a single, local collector. Remote-host monitoring, which earlier releases offered through the now-retired wsh helper (see docs/specs/archive/SPEC_RETIRE_WSH_2026_04_12.md in the main repo), is not supported.
The pane header still shows a connection selector. Leave it on the local connection: choosing any other connection leaves the pane blank.
Per-pane CPU and memory badges
Section titled “Per-pane CPU and memory badges”The same collector also measures the CPU and memory used by each pane’s processes, shown as a small badge on the pane header. For terminal panes you can hide it with Settings → Terminal → Show CPU/mem badge (term:showstatsbadge).
See Also
Section titled “See Also”- Pane Types — every pane type
- The window — the status bar’s CPU, memory and disk figures, and the panels they open
- Settings reference — where settings live