
The window
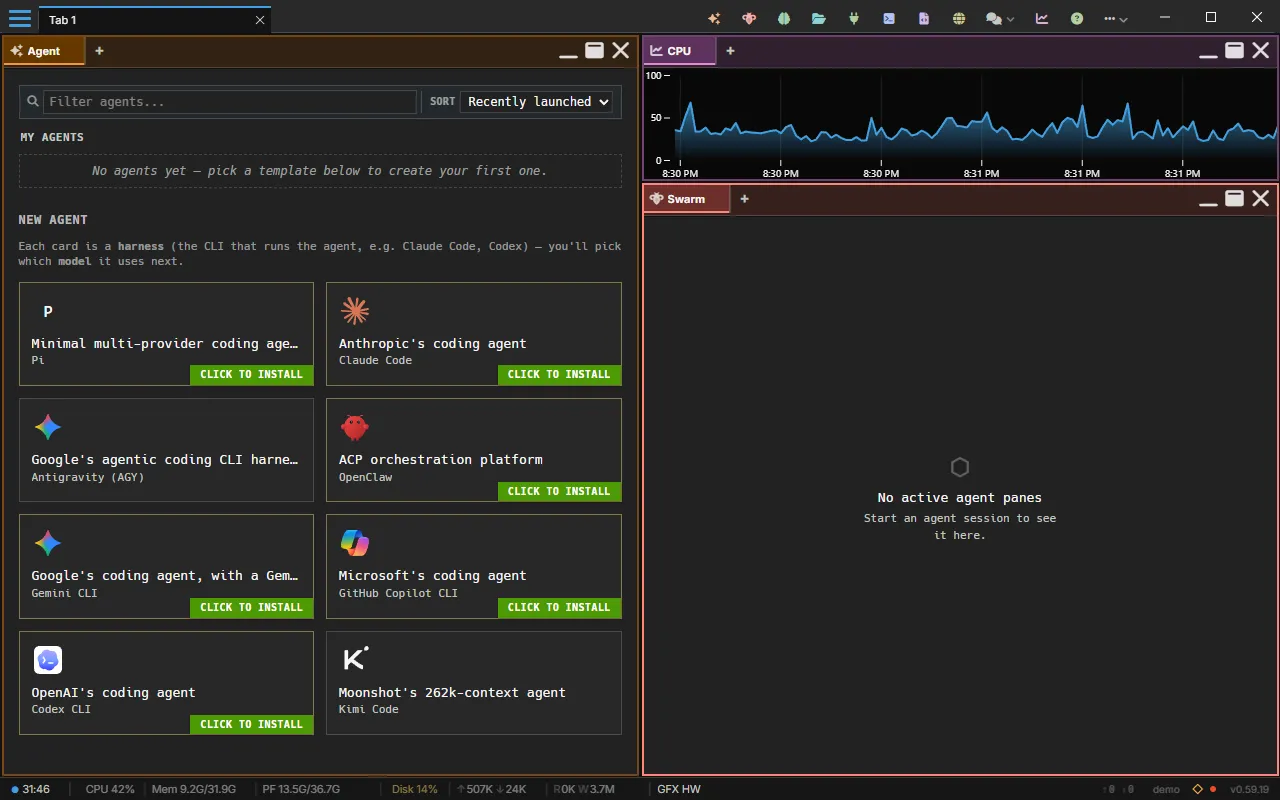
An AgentMux window has three parts: the top bar, the panes of the current tab, and the status bar along the bottom.
Top bar
Section titled “Top bar”
From left to right:
- Hamburger menu (≡): global actions and preferences. See Main menu & command palette.
- Window tabs: each tab holds its own layout of panes. New Tab (
Ctrl+Shift+T/⌘T) adds one; drag a tab below the tab bar to tear it off into a new window. - Widget bar: one icon per pinned widget; click one to open it. Widgets that aren’t pinned are under more at the end of the bar. Right-click a pinned icon to unpin it.
- Window buttons: minimize, maximize and close.
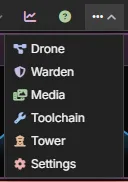
The widget bar’s More list
Section titled “The widget bar’s More list”Hover more (or click it) to list the widgets that aren’t pinned to the bar. Click one to open it.
A tab’s menu
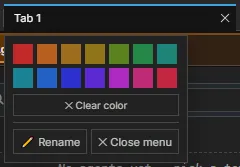
Section titled “A tab’s menu”Right-click a window tab to colour it or rename it: pick one of 14 colours, Clear color to remove it, or Rename. The colour is stored with the tab (tab:color).
Closing a tab
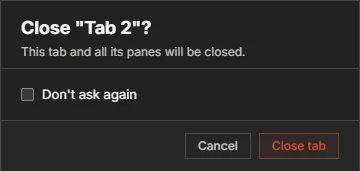
Section titled “Closing a tab”A tab’s close button (×) asks first, because the tab’s panes close with it. Tick Don’t ask again (or turn on Skip tab close confirmation in Settings → Window & Panes) to close tabs straight away from then on.
Each pane has a header that is also its tab strip: a pane can hold several tabs of any widget type. The buttons at the right of the header minimize the pane, maximize it to fill the tab, and close it. Right-click the header for the pane’s menu. See Pane Management for splitting, pane tabs, moving panes and floating them.
Status bar
Section titled “Status bar”
From left to right:
| Item | Shows | Click it for |
|---|---|---|
| Backend status | A status dot and how long the backend has been up | The backend panel |
| CPU | Total CPU use | The load on each core |
| GPU | GPU use, where the platform reports it | — |
| Mem | Memory used and total | — |
| PF | Commit charge used and total: RAM plus the page file budget (Windows) | — |
| Disk | How much of the system drive is free (its colour warns as it fills) | Free space on each drive |
| ↑ ↓ | Network upload and download | — |
| R W | Disk reads and writes | — |
| GFX | Whether the window is drawn by the GPU (HW), in software (SW), or without WebGL | — |
| ↑ ↓ (right) | Tokens your agents have sent and received this session | Token usage by service |
| Host name | This computer’s name, with the LAN discovery indicator (◇) and the MuxBus Cloud dot | The host panel |
| Version | The AgentMux version | The instance panel |
Hover an item for a short description. Each panel closes with Esc or a click outside it.
Backend
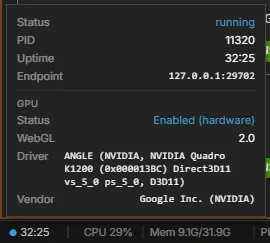
Section titled “Backend”The backend’s status, process id, uptime and endpoint, and how the window is drawn: whether graphics are hardware accelerated, the WebGL version, and the graphics driver.
CPU cores
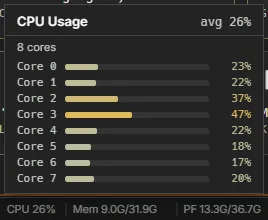
Section titled “CPU cores”The load on each CPU core, and the average.
Disk space
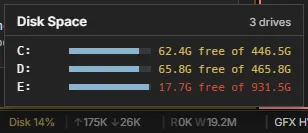
Section titled “Disk space”Each drive’s free space and size. The Disk figure in the bar is the system drive’s free share.
Token usage
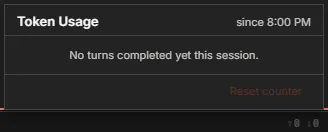
Section titled “Token usage”Tokens sent and received since the time shown, by service. Reset counter starts the count again.
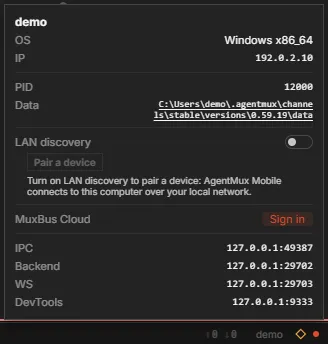
This computer: its OS, address, the backend’s process id, and the version’s data folder (click the path to open it in your file manager). Below that: the LAN discovery switch and Pair a device, MuxBus Cloud sign-in, and the local endpoints (IPC, backend, WebSocket, DevTools).
Instance panel
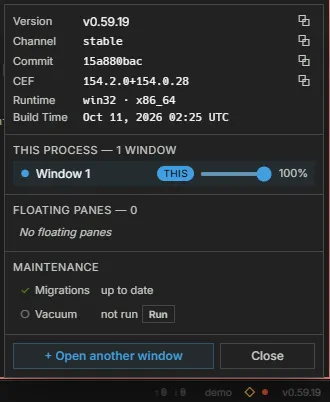
Section titled “Instance panel”This AgentMux instance: its version, channel, commit, CEF version, runtime and build time (each with a copy button), the windows this process has open with an opacity slider for each, its floating panes, and maintenance (database migrations and vacuum). Open another window opens a new window of this instance. See Window appearance for the opacity slider and Report issues for what to copy into a bug report.
See also
Section titled “See also”- Main menu & command palette
- Pane Types and Pane Management
- Settings reference
- System Metrics: the Sysinfo widget’s graphs